4 Hour Service by Job Name |
  
|
4 Hour Service by Job Name |
|
Shows 4 hour rolling average of CPU service during the report period. Service is plotted by Job Name. The largest jobs (top 10 by default) are shown by name, with all others grouped together.
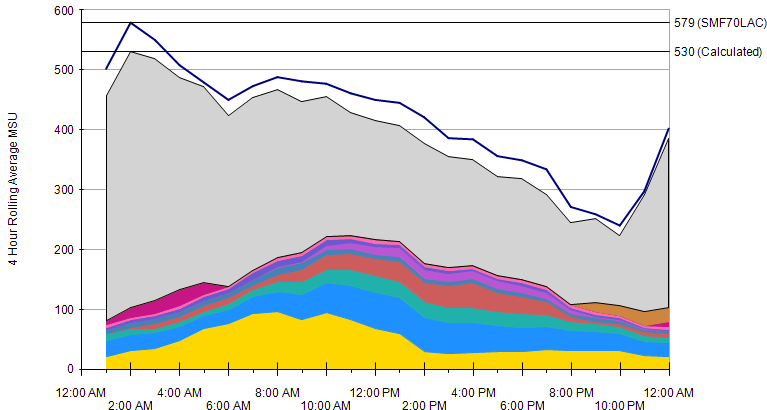
The 4 hour rolling average is calculated from CPU service values in type 30 records.
The 4 hour average from type 30 records is not expected to exactly match the actual 4HRA, due to capture ratios and different methods of measurement for the type 30 and type 70 records. However it should be close enough to provide useful information about the work that makes up the 4HRA. The 4HRA value from the type 70 records is also plotted so you can verify how close the type 30 service values are to the actual values.
Report Parameters
Parameter |
Description |
Sysplex |
Filter by sysplex name. |
System |
Filter by system name. |
CEC |
Filter by physical machine (CEC). |
Service Class |
Filter by Service Class |
Report Class |
Filter by Report Class |
Jobname |
Filter by Job Name |
Top |
Show top n jobs - default 10. The rest will be grouped into "Other". |
SMF records used for this report
Type |
Subtype |
70 |
1 |
30 |
2,3,6 |