CPU Service by Service Class and CPU Service by Report Class |
  
|
CPU Service by Service Class and CPU Service by Report Class |
|
Shows CPU service consumed by service or report class during the report period, plotted separately for each CPU type.
CPU Service by Report Class will also show the quantity of work without a report class assigned, by comparing the service class and report class totals.
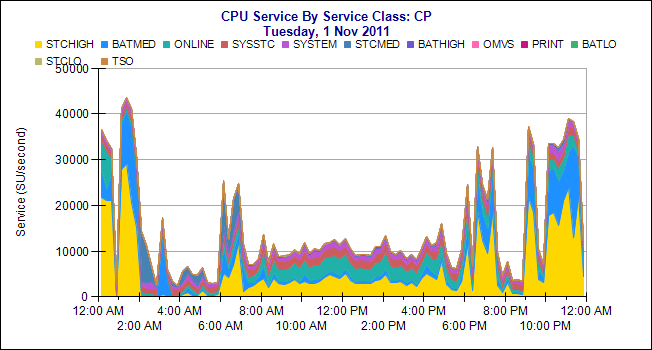
Where data is reported service will be plotted for:
•CP service (with 4 Hour Rolling Average MSU if selected)
•zIIP service
•zIIP on CP service
•zAAP service
•zAAP on CP service
Report Parameters
Parameter |
Description |
Sysplex |
The sysplex name. |
System |
The SMF ID of the system that wrote the record. |
Service Class / Report Class |
Filter by service or report class. |
Show 4HRA MSU |
Plot the 4 Hour Rolling Average MSU on the CP Service chart so that it can be related to the service classes using service. The 4HRA MSU is only plotted if a single system is selected. |
Sync Chart Scales |
If selected, all the charts will use the same scale for service. This allows comparison between the charts. If not selected, different scales may be used for different charts. This allows more detail to be seen where the service used is low, but makes it difficult to compare between charts e.g. zIIP service and CP service. |
SMF records used for this report
Type |
Subtype |
70 |
1 |
72 |
3 |